The principle in detail
Three steps through the principle: grasp it, place it, put it to work. Open each topic on its own.
The core messageCore statement and 3 clarifications
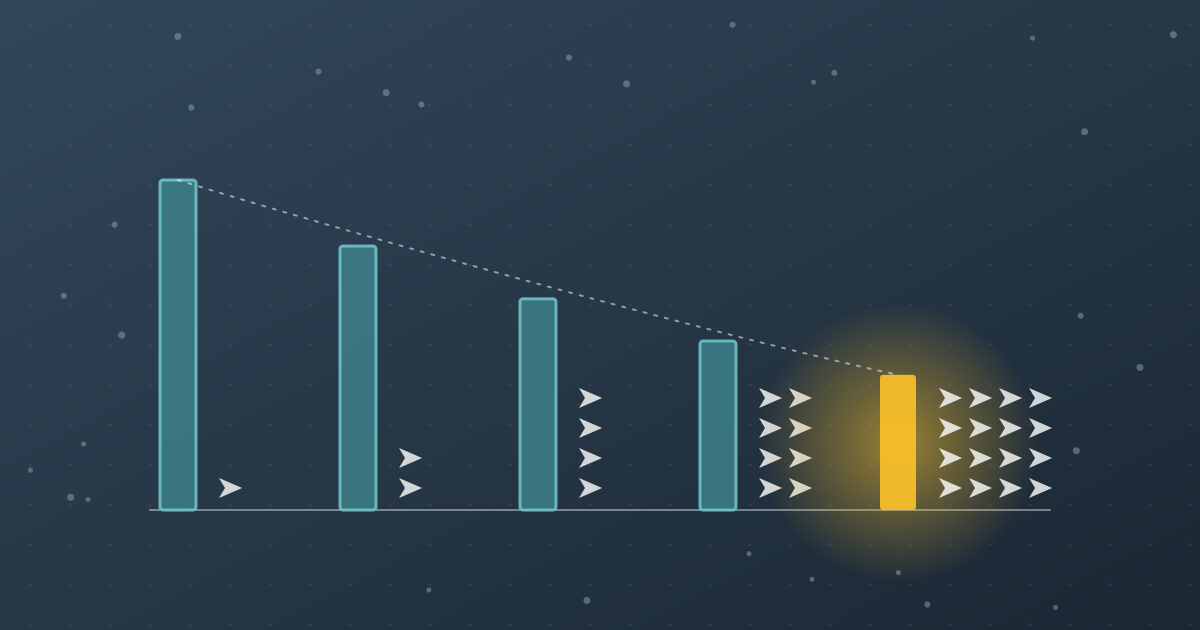
As the total quantity grows, the effort per unit falls, because an entire organization learns, not just a single person.
- It does not say
- That costs fall by themselves. If you do not review your experience, you stay stuck on the curve.
- It does not say
- That volume is everything. If you chase speed alone, you put quality at risk, as the brittle fractures of some Liberty ships show.
- It also says
- A new technology starts its own curve and can undercut the old one.
The explanationHow the principle works and what matters
- Costs fall for many reasons at once: people become more practiced, processes are improved, tools are added, products become easier to make.
- Whoever produces the most comes down the curve the fastest.
- But it does not happen by itself.
Which recurring task do you do every time as if it were the first time?
The signs3 signs when you heed it · 3 when you overlook it
- Recurring tasks are briefly reviewed after each round.
- There are checklists and fixed procedures, and they get improved.
- You know how long a core task takes today and how long it took a year ago.
- Every event, every year-end close, every onboarding starts from scratch.
- The same mistakes turn up every year.
- Or the team keeps getting faster while quality and new ways of working drop out of sight.
The backgroundFrom Theodore Paul Wright’s article “Factors Affecting the Cost of Airplanes” (1936). · T6 Business Strategy
- 1936OriginTheodore Paul Wright
Factors Affecting the Cost of Airplanes
- Tradition T6TraditionBusiness Strategy
Michael E. Porter, Richard P. Rumelt, Henry Mintzberg, Clayton M. Christensen, W. Chan Kim and Renée Mauborgne
See the tradition on the Origin page
Read more: the full background
From Theodore Paul Wright’s article “Factors Affecting the Cost of Airplanes” (1936). Generalized by Bruce D. Henderson and the Boston Consulting Group in the 1960s, later collected in “Henderson on Corporate Strategy” (1979).
The research4 sources: 2 theories, 1 primary study, 1 review · 1936–1991 · with limitations of the research
- weak
- moderate
- strong
Falling unit costs with growing total quantity have been observed in many industries; whether a lasting lead follows from this is disputed.
- 1936Theodore Paul Wright
“Factors Affecting the Cost of Airplanes”: the labor required per airplane falls by about 20% with every doubling of the quantity built.
- 1968Bruce D. Henderson
“The Experience Curve”: costs fall by a constant share with every doubling of cumulative volume if management actively lowers them; market share becomes the key.
- 1974William J. Abernathy and Kenneth Wayne
“Limits of the Learning Curve”: a company that focuses entirely on cutting costs can become rigid and miss the switch to new products.
- 1991Ernst R. Berndt
“The Practice of Econometrics,” chapter “Costs, Learning Curves, and Scale Economies”: learning effects and economies of scale are hard to separate.
- The experience curve is an observation, not a law of nature.
- It is hard to separate from pure economies of scale.
- A company that focuses entirely on cutting costs can become rigid and miss the switch to new products.
- Strategies that build up capacity in advance to come down the curve faster are viewed critically in research.
- Michael E. Porter showed that differentiation is an alternative to a cost lead.
- The stated range of declines varies by source; in 1968, Bruce D. Henderson even cited 20 to 30%.
Read more: what research shows
In 1936, Theodore Paul Wright observed in aircraft manufacturing that the labor required per airplane fell by about 20% with every doubling of the quantity built, and he turned this into a mathematical model; today the rule is known as Wright’s law. In the 1960s, the Boston Consulting Group under Bruce D. Henderson generalized the model for entire industries and called it the experience curve. In 1968, Bruce D. Henderson wrote that costs do not fall by themselves but only if management actively lowers them, and concluded that market share is the key to low costs. Studies report declines of about 10 to 25% per doubling, depending on the industry. Ernst R. Berndt stresses that experience and pure economies of scale can hardly be separated.
The related principles70 Positioning · 76 Disruption · 77 Network Effects · 78 First Movers and Followers
To go deeper, see 70 Positioning (the experience curve is an important basis of cost leadership) and 77 Network Effects (both describe how size reinforces itself)
78 First Movers and Followers often depends on who accumulates more volume
76 Disruption stands in tension with it: new technologies start their own curve and can undercut the old one
Read more: the full text
To go deeper, see 70 Positioning (the experience curve is an important basis of cost leadership) and 77 Network Effects (both describe how size reinforces itself); 78 First Movers and Followers often depends on who accumulates more volume. 76 Disruption stands in tension with it: new technologies start their own curve and can undercut the old one.
The action steps5 action steps: Choose the three tasks that recur most often in your area.
Choose the three tasks that recur most often in your area.
For one of them, measure how long each round takes, and write the number down.
- Review each round in five minutes: what will we do differently next time? Write down one improvement.
Alongside speed, always check the quality of the result as well.
Once a year, look at whether a new way of working or a new technology could overtake your curve.
The reflection questions3 questions: Which task does your team do every time as if it were the first time?
- Which task does your team do every time as if it were the first time?
- How would you notice that a recurring task takes less effort today than it did a year ago?
- What new way of working could overtake your well-practiced routine?
Take your time with one question. Write down your answer – or talk it over with someone you trust.
The picture to rememberThe animation once more, with an explanation
- A gold dot traces a curve from the top left to the bottom right
- With every doubling, a row of small teal dots is added (1, 2, 4, 8, 16), and the steps down get smaller
- At the turning point, a mist-blue curve next to it runs more slowly and stays higher
- In the final image, a new, lower gold line slides in from the right and passes beneath the old one
How the principle shows up in practice
Theodore Paul Wright
In 1936, the aeronautical engineer showed that the labor required per airplane falls by about 20% with every doubling of the quantity. In doing so, he made learning in the factory measurable.
The Liberty ships
During World War II, the construction time of the 2,710 standardized freighters fell from about 230 to 39 days. At the same time, the brittle fractures show that speed does not guarantee quality.
Swanson’s law
From 1977 to 2014, the price of solar cells fell from about $77 to 36 cents per watt. In the end, the manufacturers with the greatest volume had the advantage.
What do you learn from every repetition?
Get your profile across all 12 groups in about 10 to 15 minutes.
Start the Strategy CheckGroup 9: Markets and Organizations
Guiding question: How does an organization win in the long run?
Stage 3 of 5: Choose the path
- TraditionBusiness Strategy
Michael E. Porter, Richard P. Rumelt, Henry Mintzberg, Clayton M. Christensen, W. Chan Kim and Renée Mauborgne
- Related principles
Where the 92 principles come from: eight traditions of strategy, from classical war theory to dealing with uncertainty.
More about the originBackground: WEGVISOR’s own selection from the strategy literature · More about the origin